Process Costing
Oftentimes the production of manufactured products is easily divisible into specific jobs, and the job costing method illustrated in the previous chapter is appropriate. However, the job costing method does not work well when the production cycle involves a continuous flow of raw materials through various processing departments, and the finished output is characterized as homogenous units, each displaying the same basic characteristics. Examples of such “processes” are numerous. Wood pulp is processed into giant rolls of paper, refineries process crude oil into gasoline, iron ore is processed into steel, sand is processed into glass, and so forth. The physical nature of these processes makes it hard to identify and associate specific units of direct labor and direct material with the final output.
For example, oil is used to produce gasoline. Oil is pumped from the ground, transported, refined, and placed in storage. Throughout the process it is stirred, cracked, and blended so that it is not possible to trace a tank of gasoline back to a specific barrel of oil.
PROCESS COSTING
How would one associate the cost of barrels of crude oil with specific gallons of finished gasoline? One would logically try to develop a mathematical approach that would divide the total cost of all oil and allocate it in some proportion to all the gallons of gasoline. This is the essence of process costing. Process costing is methodology used to allocate the total costs of production to homogenous units produced via a continuous process that usually involves multiple steps or departments.
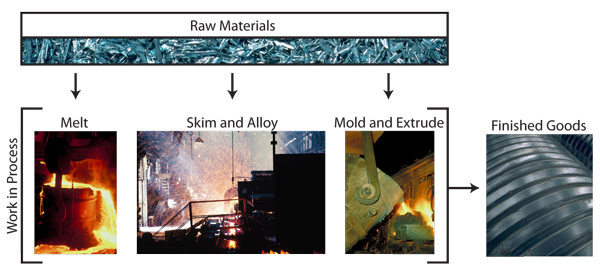
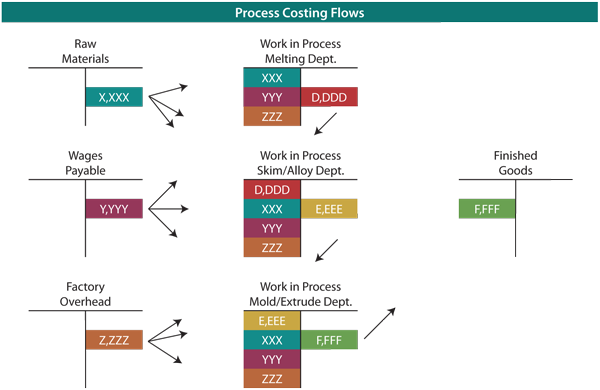
The cost flow concepts from the prior chapter are useful in understanding process costing. The reason is that the same cost flow concepts and accounts will be evident. That is, material, labor, and factory overhead will still occur and still be assigned to work in process. And, amounts assigned to work in process will in turn make their way to finished goods. The debits/credits and financial statement outcomes are very similar. The big difference between job costing and process costing arises in the work in process “units.” Remember, under job costing, costs were captured for each job (recall the discussion about job cost sheets and subsidiary amounts for each job). Under process costing, the costs are captured for each process or department. Think about a steel production factory. The basic processes for producing steel are to (1) melt iron ore (along with perhaps processed coal/coke and limestone), then (2) skim the material while adding alloys to adjust for tensile strength and flexibility, and finally (3) oxygen blast and extrude the material into its finished form (I-Beams, sheet steel, coils, etc.). Below is a representative graphic:
Oftentimes the production of manufactured products is easily divisible into specific jobs, and the job costing method illustrated in the previous chapter is appropriate. However, the job costing method does not work well when the production cycle involves a continuous flow of raw materials through various processing departments, and the finished output is characterized as homogenous units, each displaying the same basic characteristics. Examples of such “processes” are numerous. Wood pulp is processed into giant rolls of paper, refineries process crude oil into gasoline, iron ore is processed into steel, sand is processed into glass, and so forth. The physical nature of these processes makes it hard to identify and associate specific units of direct labor and direct material with the final output.
For example, oil is used to produce gasoline. Oil is pumped from the ground, transported, refined, and placed in storage. Throughout the process it is stirred, cracked, and blended so that it is not possible to trace a tank of gasoline back to a specific barrel of oil.
PROCESS COSTING
How would one associate the cost of barrels of crude oil with specific gallons of finished gasoline? One would logically try to develop a mathematical approach that would divide the total cost of all oil and allocate it in some proportion to all the gallons of gasoline. This is the essence of process costing. Process costing is methodology used to allocate the total costs of production to homogenous units produced via a continuous process that usually involves multiple steps or departments.
The cost flow concepts from the prior chapter are useful in understanding process costing. The reason is that the same cost flow concepts and accounts will be evident. That is, material, labor, and factory overhead will still occur and still be assigned to work in process. And, amounts assigned to work in process will in turn make their way to finished goods. The debits/credits and financial statement outcomes are very similar. The big difference between job costing and process costing arises in the work in process “units.” Remember, under job costing, costs were captured for each job (recall the discussion about job cost sheets and subsidiary amounts for each job). Under process costing, the costs are captured for each process or department. Think about a steel production factory. The basic processes for producing steel are to (1) melt iron ore (along with perhaps processed coal/coke and limestone), then (2) skim the material while adding alloys to adjust for tensile strength and flexibility, and finally (3) oxygen blast and extrude the material into its finished form (I-Beams, sheet steel, coils, etc.). Below is a representative graphic:
COMPARING JOB AND PROCESS COSTING
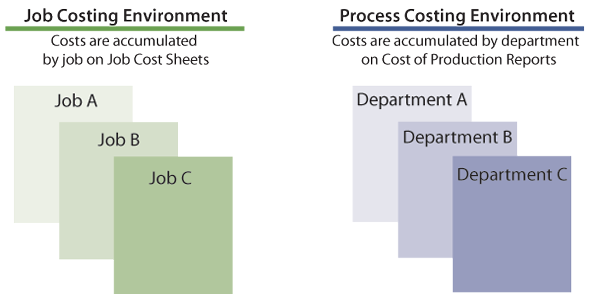
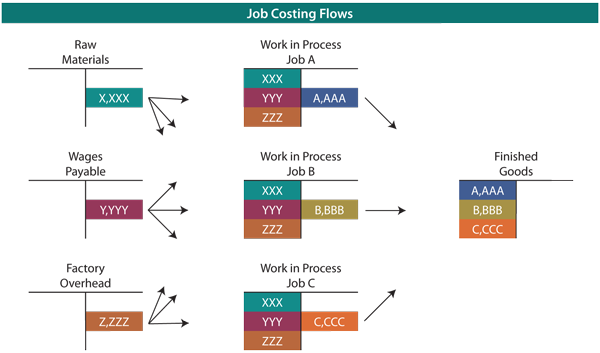
Note in the above graphic the familiar inventory categories relating to raw materials, work in process, and finished goods. However, rather than observing work in process as being made up of many individual/discrete jobs, see that it instead consists of individual/discrete processes like melting, skimming, and extruding. Material can be introduced into each process. Ore is introduced in the melting stage, alloys in the skimming stage, etc. (this is equally true for labor and overhead). This necessitates the employment of a separate Work in Process account for each major manufacturing activity. Examine the graphic below that compares job and process costing, noting in particular the difference in how costs are shifted out of work in process. Process costing entails handing off accumulated costs from one department to the next.
Note in the above graphic the familiar inventory categories relating to raw materials, work in process, and finished goods. However, rather than observing work in process as being made up of many individual/discrete jobs, see that it instead consists of individual/discrete processes like melting, skimming, and extruding. Material can be introduced into each process. Ore is introduced in the melting stage, alloys in the skimming stage, etc. (this is equally true for labor and overhead). This necessitates the employment of a separate Work in Process account for each major manufacturing activity. Examine the graphic below that compares job and process costing, noting in particular the difference in how costs are shifted out of work in process. Process costing entails handing off accumulated costs from one department to the next.
COST OF PRODUCTION REPORT
With a job costing system, the costs of each job are tabulated on a job cost sheet. A similar tabulation of costs is needed for process costing but with emphasis on costs by department. The cost report that is prepared for each department is termed a cost of production report. The cost of production report provides comprehensive information on the material, labor, and overhead incurred within each department during a period. It is the primary source document for determining how those costs are allocated to actual production. Before looking more closely at the specific content of a cost of production report, it is first necessary to introduce a new concept called “equivalent units.”
With a job costing system, the costs of each job are tabulated on a job cost sheet. A similar tabulation of costs is needed for process costing but with emphasis on costs by department. The cost report that is prepared for each department is termed a cost of production report. The cost of production report provides comprehensive information on the material, labor, and overhead incurred within each department during a period. It is the primary source document for determining how those costs are allocated to actual production. Before looking more closely at the specific content of a cost of production report, it is first necessary to introduce a new concept called “equivalent units.”
Equivalent Units
When goods are produced in a continuous process, how are costs to be allocated between work in process and finished goods? Accountants have devised the concept of an equivalent unit. An equivalent unit is a physical unit expressed in terms of a finished unit.
For example, 10 units in process that are 30% complete equate to 3 equivalent units of output. None of the 10 units is complete; merely the equivalent amount of work necessary to complete 3 units is said to be performed.
FACTORS OF PRODUCTION
Equivalent units must be considered relative to each of the factors of production. In other words, 80% of necessary direct material may be in process but only 60% of the direct labor and factory overhead. Therefore, proper costing methodology for 100 units in process would entail 80 equivalent units of material, and 60 equivalent units of conversion (i.e., labor and overhead).
To assess the equivalent units of production requires careful reasoning about the amount of direct material injected into production for each department, relative to the total amount of direct material that will ultimately be needed to complete the process within that department. This type of assessment must be repeated for direct labor and overhead. If overhead is applied based on labor, the process is simplified because the “percent complete” would be the same for labor and overhead.
However, if overhead is applied on some other basis (like machine hours) then a separate determination of equivalency would be needed for labor and for overhead (the illustrations within this chapter will assume overhead is applied based on labor).
|
EXAMPLE:
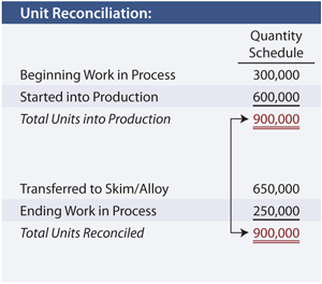
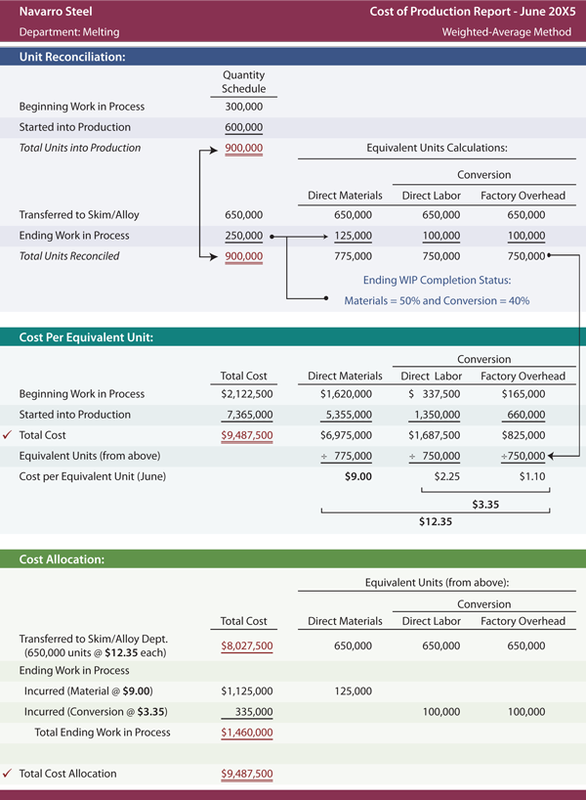
To better understand equivalent units, focus on an example for Navarro Steel. To begin, one needs to identify the total units that are to be considered, no matter their stage of completion at the beginning and end of the month. The first stage in Navarro’s production process is the Melting Department. Navarro started the month of June with 300,000 tons of iron ore in process in the Melting Department. During June, an additional 600,000 tons were introduced into the melting vats. This means 900,000 total units must be reconciled. The quantity schedule provides this reconciliation. It shows that 650,000 units were transferred on to the Skim/Alloy Department, leaving 250,000 tons still in process. In reconciling total units into production with the total units transferred out/still in process, it is not uncommon for there to be a shortfall. The reason is that many processes may involve scrap, waste, or spoilage (e.g., evaporation, spilling, etc.). Waste and spoilage would be |
|
added as a third component needed to balance the lower portion of the quantity schedule column.
Advanced managerial accounting courses usually demonstrate the mechanics of handling the cost of spoilage within a process cost system. However, for now simply know that the cost of “normal” spoilage should be allocated to the inventory of good units, while the cost of excessive waste is charged off as a loss on the income statement.
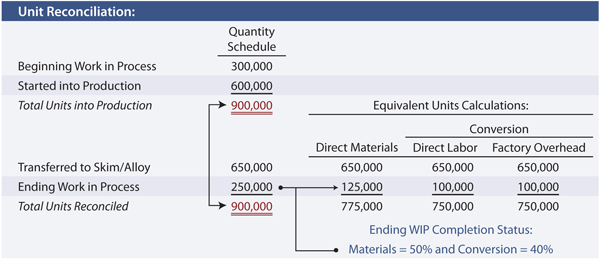
Once the total units have been reconciled, the equivalent units are computed. The correct manipulation of the data will depend on the inventory method in use. In this illustration, Navarro is assumed to use the weighted-average costing method (other approaches such as FIFO could be used). This simplifies the process because the beginning inventory and current period production can be combined or “averaged” together.
Thus, the 650,000 units that were completed are counted as 650,000 equivalent units of output no matter their physical origin from beginning inventory or otherwise. However, the units in ending work in process require more thoughtful consideration.
Assume that the 250,000 tons in ending work in process are 50% complete with respect to material (i.e., 125,000 equivalent units) and 40% complete with respect to conversion (i.e., 100,000 equivalent units). The following schedule shows how the total units are translated into equivalent units:
Advanced managerial accounting courses usually demonstrate the mechanics of handling the cost of spoilage within a process cost system. However, for now simply know that the cost of “normal” spoilage should be allocated to the inventory of good units, while the cost of excessive waste is charged off as a loss on the income statement.
Once the total units have been reconciled, the equivalent units are computed. The correct manipulation of the data will depend on the inventory method in use. In this illustration, Navarro is assumed to use the weighted-average costing method (other approaches such as FIFO could be used). This simplifies the process because the beginning inventory and current period production can be combined or “averaged” together.
Thus, the 650,000 units that were completed are counted as 650,000 equivalent units of output no matter their physical origin from beginning inventory or otherwise. However, the units in ending work in process require more thoughtful consideration.
Assume that the 250,000 tons in ending work in process are 50% complete with respect to material (i.e., 125,000 equivalent units) and 40% complete with respect to conversion (i.e., 100,000 equivalent units). The following schedule shows how the total units are translated into equivalent units:
COST PER EQUIVALENT UNIT
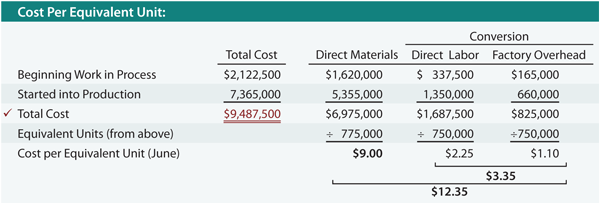
The equivalent unit calculations are carried forward into the “cost per equivalent unit” schedule. This shows how the combined costs from beginning work in process (assumed at $2,122,500) and current period production (assumed at $7,365,000) are divided by the equivalent units. The result is the weighted-average cost per equivalent unit for each factor of production. The individual cost factors can be combined to identify conversion cost and overall cost per equivalent unit.
The equivalent unit calculations are carried forward into the “cost per equivalent unit” schedule. This shows how the combined costs from beginning work in process (assumed at $2,122,500) and current period production (assumed at $7,365,000) are divided by the equivalent units. The result is the weighted-average cost per equivalent unit for each factor of production. The individual cost factors can be combined to identify conversion cost and overall cost per equivalent unit.
Cost Allocation To Completed Units And Units In Process
The cost per equivalent unit calculations are used to allocate cost incurred between a department’s completed production and the units in ending work in process. Carefully examine the following schedule to see that the cost assigned to completed units totals $8,027,500. The ending work in process is $1,460,000, determined as 125,000 equivalent units at $9.00 each, plus 100,000 equivalent units of conversion at $3.35 each.
The cost per equivalent unit calculations are used to allocate cost incurred between a department’s completed production and the units in ending work in process. Carefully examine the following schedule to see that the cost assigned to completed units totals $8,027,500. The ending work in process is $1,460,000, determined as 125,000 equivalent units at $9.00 each, plus 100,000 equivalent units of conversion at $3.35 each.
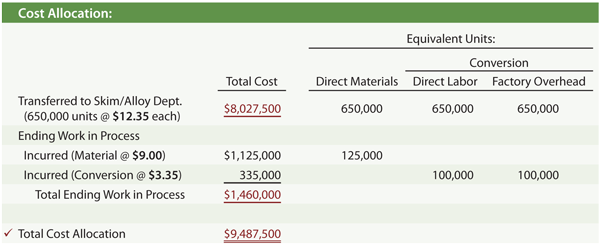
Note that a check mark is placed beside the total cost allocation ($9,487,500 = $8,027,500 + $1,460,000) as a reminder that this schedule must allocate the entire cost incurred within the Melting Department.
COST OF PRODUCTION REPORT
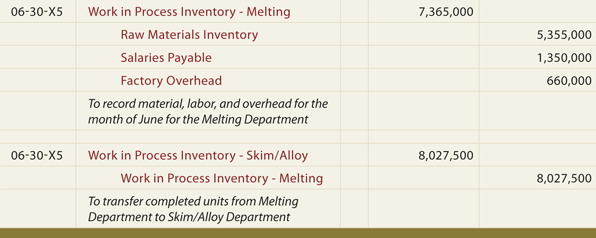
The preceding schedules are combined into a single cost of production report as shown below. A similar report would be prepared for each department.
These reports are used for many management purposes, such as inventory control, efficiency studies, incentive pay plans, and the like. They also provide the basis for the following entries that are needed to update the ledger accounts for the inventory cost allocations.
ANALYSIS OF COST FLOW
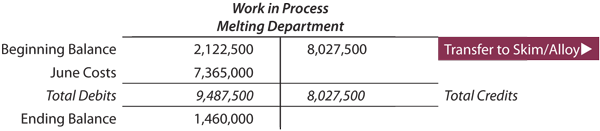
The journal entries, along with the beginning work in process of $2,122,500, result in an ending work in process of $1,460,000.
The following T-account portrays the cost flow through the Work in Process account of the Melting Department:
The journal entries, along with the beginning work in process of $2,122,500, result in an ending work in process of $1,460,000.
The following T-account portrays the cost flow through the Work in Process account of the Melting Department:
ADDED PROCESSES
It is important to notice that the journal entry to transfer $8,027,500 out of the Melting Department (credit) is offset with an increase in the Work in Process of the Skim/Alloy Department (debit).
The Skim/Alloy Department’s T-account for June might look something like this (amounts are assumed):
It is important to notice that the journal entry to transfer $8,027,500 out of the Melting Department (credit) is offset with an increase in the Work in Process of the Skim/Alloy Department (debit).
The Skim/Alloy Department’s T-account for June might look something like this (amounts are assumed):
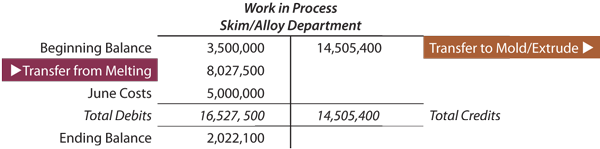
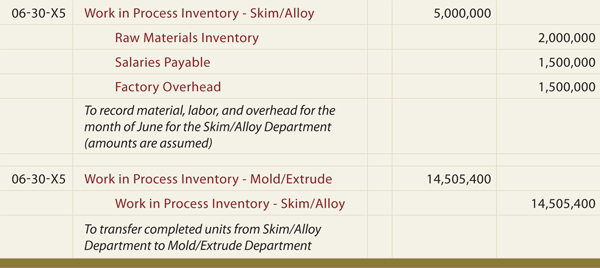
As noted within the journal entry descriptions all costs for each department were assumed. But, overhead is not in direct proportion to salaries payable for each department. This is not unexpected as there is no requirement that overhead be applied at the same rate or on the same basis in different departments.
OVERALL REVIEW
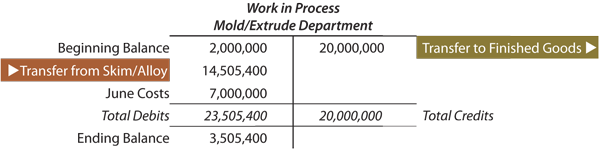
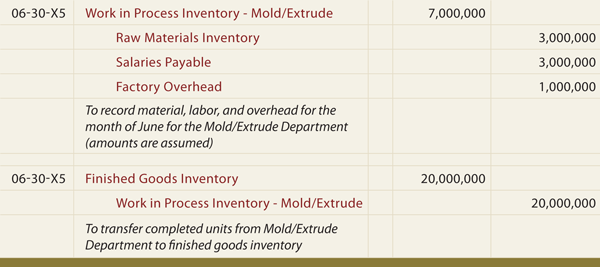
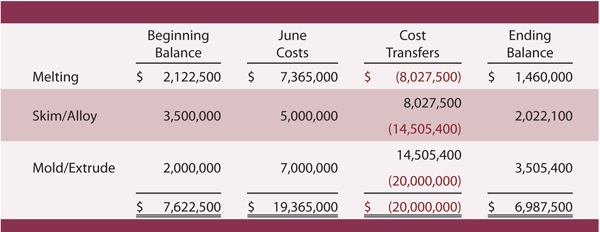
The schedule below shows that Navarro incurred $19,365,000 in costs and transferred $20,000,000 to finished goods. Total work in process inventory declined by $635,000. This is verified by comparing the beginning and ending work in process balances ($7,622,500 - $6,987,500 = $635,000). Navarro’s balance sheet at June 30 would include $6,987,500 as work in process inventory.
The schedule below shows that Navarro incurred $19,365,000 in costs and transferred $20,000,000 to finished goods. Total work in process inventory declined by $635,000. This is verified by comparing the beginning and ending work in process balances ($7,622,500 - $6,987,500 = $635,000). Navarro’s balance sheet at June 30 would include $6,987,500 as work in process inventory.
Activity-Based Costing
Many companies have expressed frustration with arbitrary allocations associated with traditional costing methods. This has led to increased utilization of a uniquely different approach called activity-based costing (ABC). A simplified explanation of ABC is that it divides production into core activities, defines costs for those activities, and allocates those costs to products based on consumption of the activities.
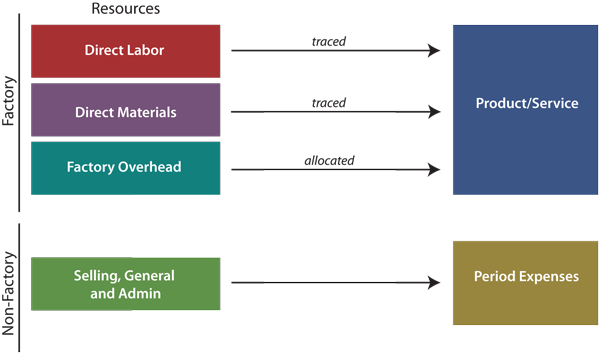
Consider that traditional costing methods divide costs into product costs and period costs. The period costs include selling, general, and administrative items and are charged against income in the period incurred. Product costs are the familiar direct materials, direct labor, and factory overhead. These costs are traced/allocated to production under both job and process costing techniques. However, some managers reject this methodology as conceptually flawed. It can be argued that a finished product should include not only the cost of direct materials, but also a portion of the administrative cost necessary to buy the materials (e.g., many companies have a separate unit in charge of purchasing). Conversely, the cost of a plant security guard is part of factory overhead, but some managers fail to see a correlation between that activity and a finished product; after all, the guard will be needed no matter how many units are produced.
BENEFITS OF ABC
Activity-based costing attempts to overcome the perceived deficiencies in traditional costing methods by more closely aligning activities with products. This requires abandoning the traditional division between product and period costs, instead seeking to find a more direct linkage between activities, costs, and products. This means that products will be charged with the costs of manufacturing and nonmanufacturing activities. It also means that some manufacturing costs will not be attached to products. This is quite a departure from traditional thought.
With ABC a product is only charged with the cost of capacity utilized. Idle capacity is isolated and not charged to a product or service. Under traditional approaches, some idle capacity may be incorporated into the overhead allocation rates, thereby potentially distorting the cost of specific output. This may limit the ability of managers to truly understand and identify the best business decisions about product pricing and targeted production levels.
LIMITING FACTORS
One limitation of ABC is that external reporting must be based on traditional absorption costing methods. Absorption costing requires the traditional division between product costs and period costs, with inventory absorbing all of the manufacturing costs and none of the period costs. As a result, ABC may produce results that differ from those required under generally accepted accounting principles (GAAP). Therefore, ABC is usually viewed as supplemental in nature. It is used for internal management decision making, but it may not be suitable for public reporting if results differ materially from absorption methods.
The fact that ABC is not GAAP usually means that a company that wishes to benefit from ABC must develop one costing system for external reporting and another for internal management. Another disadvantage of ABC is that it is usually more involved than other approaches. Rather than applying all factory overhead on some simple basis such as labor hours, it requires the development of numerous cost pools that must be individually allocated.
CATALYST FOR ABC
For a single-product company with fairly stable inventory levels, traditional and ABC methods will yield about the same results. But, for multi-product/service firms, the arbitrary allocation of costs can pretty much “make or break” the perceived profitability of each product or service. As companies have grown larger and more diverse in output, there has been an accompanying concern about how costing occurs. Arguably, product diversification has been a major contributing factor into the management accountant’s pursuit of alternative costing devices like ABC.
Another driver of ABC-type approaches has been the advent of computer technology. Before modern information systems, it was very expensive to manipulate data. Most firms were necessarily content to live with simple approaches that allocated factory overhead on a single basis. The ease with which data can be managed under a sophisticated information system greatly reduces the cost and error rate associated with ABC. It is not surprising that the method’s popularity is inversely related to data processing costs.
RECAP
This chapter will close with a case study on ABC. The case will show how results can differ significantly under ABC versus traditional costing methods. The lesson is to move carefully in using cost information. It is important to fully consider many variables, some of which are not always apparent. Managerial accounting provides many tools to support decision making. ABC is one such tool. It enables systematic review of activities that will help pinpoint opportunities for cost control and reallocation of capacity to higher yielding products. But, ABC is not perfect. In fact, ABC is no better than the process used to identify activities and cost allocations. These elements are ultimately based on human judgment.
A CLOSER LOOK AT ABC CONCEPTS
With traditional costing methods, prime costs are traced to output while factory overhead is allocated to output. Non-factory costs do not get assigned to a product:
Many companies have expressed frustration with arbitrary allocations associated with traditional costing methods. This has led to increased utilization of a uniquely different approach called activity-based costing (ABC). A simplified explanation of ABC is that it divides production into core activities, defines costs for those activities, and allocates those costs to products based on consumption of the activities.
Consider that traditional costing methods divide costs into product costs and period costs. The period costs include selling, general, and administrative items and are charged against income in the period incurred. Product costs are the familiar direct materials, direct labor, and factory overhead. These costs are traced/allocated to production under both job and process costing techniques. However, some managers reject this methodology as conceptually flawed. It can be argued that a finished product should include not only the cost of direct materials, but also a portion of the administrative cost necessary to buy the materials (e.g., many companies have a separate unit in charge of purchasing). Conversely, the cost of a plant security guard is part of factory overhead, but some managers fail to see a correlation between that activity and a finished product; after all, the guard will be needed no matter how many units are produced.
BENEFITS OF ABC
Activity-based costing attempts to overcome the perceived deficiencies in traditional costing methods by more closely aligning activities with products. This requires abandoning the traditional division between product and period costs, instead seeking to find a more direct linkage between activities, costs, and products. This means that products will be charged with the costs of manufacturing and nonmanufacturing activities. It also means that some manufacturing costs will not be attached to products. This is quite a departure from traditional thought.
With ABC a product is only charged with the cost of capacity utilized. Idle capacity is isolated and not charged to a product or service. Under traditional approaches, some idle capacity may be incorporated into the overhead allocation rates, thereby potentially distorting the cost of specific output. This may limit the ability of managers to truly understand and identify the best business decisions about product pricing and targeted production levels.
LIMITING FACTORS
One limitation of ABC is that external reporting must be based on traditional absorption costing methods. Absorption costing requires the traditional division between product costs and period costs, with inventory absorbing all of the manufacturing costs and none of the period costs. As a result, ABC may produce results that differ from those required under generally accepted accounting principles (GAAP). Therefore, ABC is usually viewed as supplemental in nature. It is used for internal management decision making, but it may not be suitable for public reporting if results differ materially from absorption methods.
The fact that ABC is not GAAP usually means that a company that wishes to benefit from ABC must develop one costing system for external reporting and another for internal management. Another disadvantage of ABC is that it is usually more involved than other approaches. Rather than applying all factory overhead on some simple basis such as labor hours, it requires the development of numerous cost pools that must be individually allocated.
CATALYST FOR ABC
For a single-product company with fairly stable inventory levels, traditional and ABC methods will yield about the same results. But, for multi-product/service firms, the arbitrary allocation of costs can pretty much “make or break” the perceived profitability of each product or service. As companies have grown larger and more diverse in output, there has been an accompanying concern about how costing occurs. Arguably, product diversification has been a major contributing factor into the management accountant’s pursuit of alternative costing devices like ABC.
Another driver of ABC-type approaches has been the advent of computer technology. Before modern information systems, it was very expensive to manipulate data. Most firms were necessarily content to live with simple approaches that allocated factory overhead on a single basis. The ease with which data can be managed under a sophisticated information system greatly reduces the cost and error rate associated with ABC. It is not surprising that the method’s popularity is inversely related to data processing costs.
RECAP
This chapter will close with a case study on ABC. The case will show how results can differ significantly under ABC versus traditional costing methods. The lesson is to move carefully in using cost information. It is important to fully consider many variables, some of which are not always apparent. Managerial accounting provides many tools to support decision making. ABC is one such tool. It enables systematic review of activities that will help pinpoint opportunities for cost control and reallocation of capacity to higher yielding products. But, ABC is not perfect. In fact, ABC is no better than the process used to identify activities and cost allocations. These elements are ultimately based on human judgment.
A CLOSER LOOK AT ABC CONCEPTS
With traditional costing methods, prime costs are traced to output while factory overhead is allocated to output. Non-factory costs do not get assigned to a product:
Compare this traditional logic to ABC, and one sees a reversal of the thought process. With ABC, cost objects are broadened to include not only products/services, but also other objects like customers, markets, and so on. These “cost objects” are seen as consuming activities. The activity driver is the event that causes consumption of an activity. For instance, each customer may receive a catalog, whether he or she orders or not during a period. Preparation and distribution of the catalog is the “activity” that is being driven by the number of customers. Activities necessarily consume resources. Thus, preparation of a catalog will require labor, printing, office space, etc. Thus, activities drive the need for resources and are said to be resource drivers. The following graphic reveals the conceptual notion of ABC for two types of cost objects, which is quite different and much more involved than the traditional costing approaches. In reviewing the graphic, notice that costs that are directly traced to a cost object need not be “routed” through an activity:
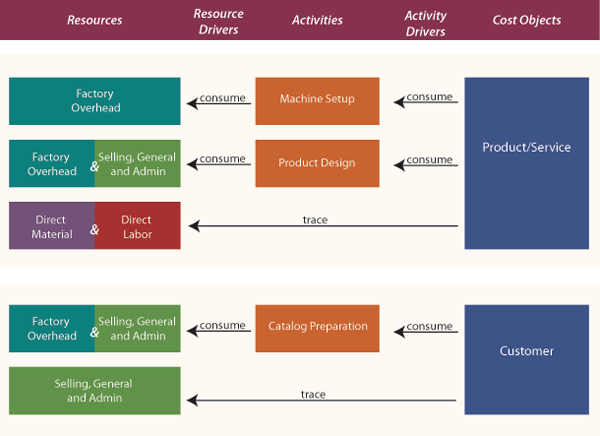
A business might have dozens of cost objects, hundreds of activities, and numerous resource pools to evaluate. A diagram of the interconnectivity can reveal multiple cost objects feeding off of many shared activities that in turn pull on various resources.
THE STEPS TO ABC
ABC requires several steps for a successful implementation:
THE STEPS TO ABC
ABC requires several steps for a successful implementation:
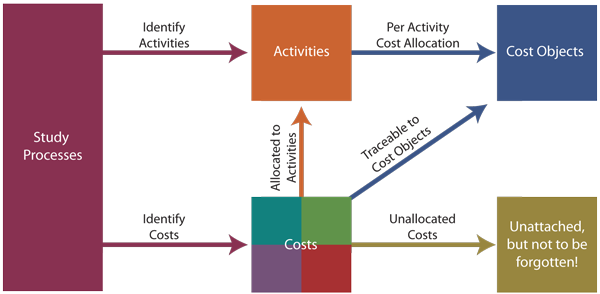
- STUDY PROCESSES AND COSTS -- The first step is a detailed study of all business processes and costs. This extensive study will usually involve employees from throughout the organization. Employee involvement is crucial for acceptance of the measures produced by the system. Employees need to believe the results of the accounting system before they will truly rely on the results.
- IDENTIFY ACTIVITIES -- Once a business is understood, care should be used in selecting the business activities that will be central to the cost allocations. Too many activities and the system will become unmanageable; too few and the information will not be meaningful. It is helpful to think of activities at different levels:
- Unit-level activities are those activities that have a one-to-one correspondence with a unit of output. For example, a telescope manufacturer may have to perform some final calibration activity to each finished product. Thus, calibration may be seen as a unit-level activity.
- Batch-level activities are those activities that must be performed, but can relate to one or more units of output. In some cases, shipping can be seen as an excellent example of a batch process. Assume that Nile is an online bookstore. Some customers order only one book while others may order a dozen books at a time. In each case the customer’s books must be packaged and shipped. Roughly the same activity is required independent of how many books are put in a box.
- Product-level activities are carried out at the product level, no matter the volume of production. Product design and marketing are activities that may have a one-to-one relation to the number of end products.
- Customer-level activities can take many forms. These include technical support help lines, catalogs, sales calls, and so on.
- IDENTIFY TRACEABLE COSTS -- Some costs can be traced directly to an end object. One example is the direct material and direct labor that goes into a product. But, there are other examples. The preparation of a product catalog can consume many hours of indirect labor and other internal resources that would be attributable to a related activity cost pool, but it may also involve an outside printer/postage and that cost can be traced right to the “customer” cost object.
- ASSIGN REMAINING COSTS TO ACTIVITIES -- Remaining costs are assigned to activities. As an example, there may be a separate industrial engineering group that does nothing but machine setup prior to a production run. The cost of this group is easily assigned to the machine setup activity, which in turn will be reallocated to a variety of end products. However, the janitorial group may perform a major cleanup after each machine setup. Perhaps 10% of the janitorial staff’s time should be assigned to machine setup and the other 90% to general maintenance. Some resources are consumed and no one can agree as to the cost object that should absorb the resource. For example, what object should bear the cost of landscaping the corporate office? Suffice it to say that the cost allocation decisions can be contentious, and some costs may never find a logical home. Therefore, ABC may leave some costs as unallocated. Unallocated does not mean to “ignore.” While it may be perfectly logical to leave some costs as unallocated for purposes of identifying the cost of a specific product or other cost object, it would be foolhardy to forget about those costs in overall management of the organization.
- DETERMINE PER-ACTIVITY ALLOCATION RATES -- Once costs for each activity have been determined it is then necessary to unitize the cost pool. For example, if the catalog preparation activity cost pool contained $500,000 and 200,000 catalogs were produced, then the allocated catalog cost would be $2.50 each.
- APPLY COSTS TO OBJECTS -- The final step is to utilize the activity-based rates in determining the amount of activity cost to allocate to each cost object. The allocated cost from the catalog preparation pool was $2.50 per unit. This is not the total cost; this is just the allocated amount. The total cost would also include the directly traceable amounts (printing, postage, etc.). This catalog cost, along with other customer-related costs would be compiled in a summary report. Managers would then have a measure of how much it costs to support one additional customer. Similarly, measures would be produced for each additional cost object.
A CASE STUDY
David Eng enjoys portable digital music players and golf. However, he was frustrated because the cord for his digital music player interfered with his golf swing. This problem prompted him to form the Golf and Music Enthusiast Company (GAME).
GAME developed two specialized products. The first product is GLASSESong, a pair of sunglasses with a built-in music player. The other is CAPlayer, a golf cap with a built-in music player having a very short unobtrusive cord from the cap to the speakers.
GAME has been employing traditional costing methods, and applies factory overhead on the basis of labor costs. The products sell as fast as they can be produced so there is virtually no inventory. For a recent period CAPlayer sold 90,000 units and GLASSESong sold 110,000 units. Each unit sells for $60 and total sales are $12,000,000 ((90,000 + 110,000) X $60).
David Eng’s latest frustration is with the CAPlayer. It is reportedly much more expensive to produce than GLASSESong. Following is an analysis of GAME’s cost of production by product.
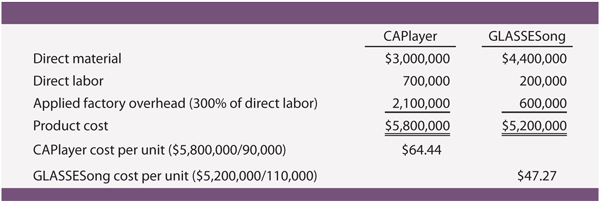
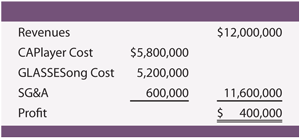
SG&A totaled $600,000. Resulting in a $400,000 profit as shown. Nevertheless, the per unit data suggest that the CAPlayer is losing money because the sales price is below the $64.44 unit cost. Eng has employed a consultant to review costing techniques. The consultant used ABC and concluded that CAPlayer is more profitable than GLASSESong.
STUDY PROCESSES AND COSTS
|
The consultant’s study began with a review of the business which revealed the following:
|
|
IDENTIFY ACTIVITIES
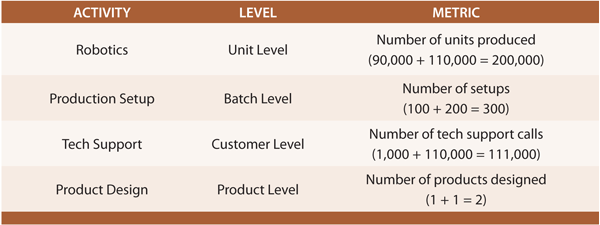
After carefully studying GAME Company, the consultant identified 4 unique activities. Each of these activities was a significant consumer of resources and generated substantial costs. The robotics function related to the operation of the highly automated assembly line. A large part of the cost of robotics was tied directly to the number of units produced. Production setup was a batch level activity. The company was required to set up the assembly process for each batch of caps and glasses. Tech support was driven by the number of customers. Each purchaser of the glasses was identified as a “customer” and each golf course was identified as a “customer.” The activity driver for product design is the number of products.
After carefully studying GAME Company, the consultant identified 4 unique activities. Each of these activities was a significant consumer of resources and generated substantial costs. The robotics function related to the operation of the highly automated assembly line. A large part of the cost of robotics was tied directly to the number of units produced. Production setup was a batch level activity. The company was required to set up the assembly process for each batch of caps and glasses. Tech support was driven by the number of customers. Each purchaser of the glasses was identified as a “customer” and each golf course was identified as a “customer.” The activity driver for product design is the number of products.
ALLOCATE COSTS
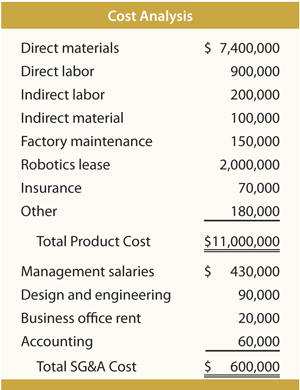
Of the total costs, direct material and direct labor were traceable directly to the product cost object. The other costs were either deemed attributable to one of the 4 activities, or otherwise not allocated.
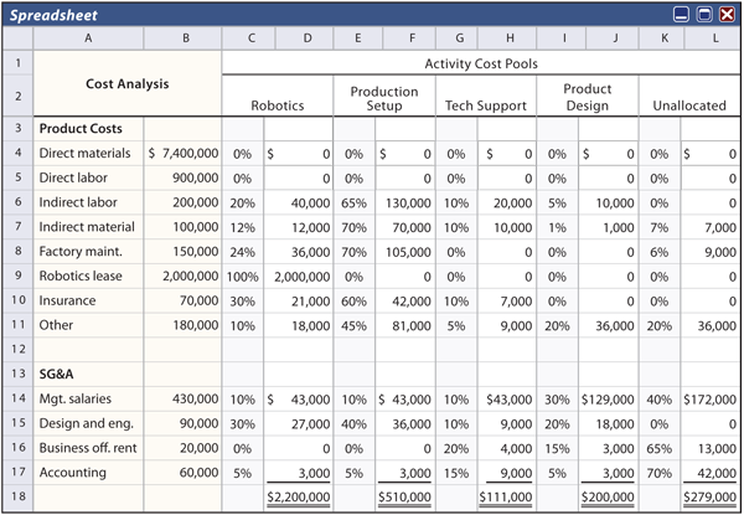
The following spreadsheet was prepared based on careful analysis, interviews, and meetings. Columns C, E, G, and I show the percentage of each cost category attributable to each of the 4 activities. Column K reveals the proportion of each cost that is not allocated. The costs from Column B are multiplied by the percentages to make allocations to each cost pool. For example, 12% of the total indirect material is allocated to robotics ($100,000 from cell B7 X 12% from cell C7 = $12,000 found in cell D7). This process is repeated for each cost and results in the allocations shown.
Of the total costs, direct material and direct labor were traceable directly to the product cost object. The other costs were either deemed attributable to one of the 4 activities, or otherwise not allocated.
The following spreadsheet was prepared based on careful analysis, interviews, and meetings. Columns C, E, G, and I show the percentage of each cost category attributable to each of the 4 activities. Column K reveals the proportion of each cost that is not allocated. The costs from Column B are multiplied by the percentages to make allocations to each cost pool. For example, 12% of the total indirect material is allocated to robotics ($100,000 from cell B7 X 12% from cell C7 = $12,000 found in cell D7). This process is repeated for each cost and results in the allocations shown.
DETERMINE PER-ACTIVITY RATES
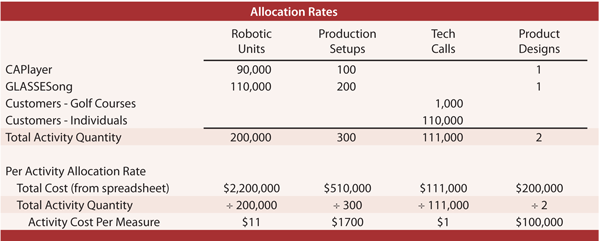
The total cost for each activity pool is divided by the activity quantity metric. For example, robotics cost $2,200,000 and 200,000 units were produced. Thus, this activity cost is $11.00 per unit. This calculation is repeated for each activity cost pool, and is summarized in the following schedule.
The total cost for each activity pool is divided by the activity quantity metric. For example, robotics cost $2,200,000 and 200,000 units were produced. Thus, this activity cost is $11.00 per unit. This calculation is repeated for each activity cost pool, and is summarized in the following schedule.
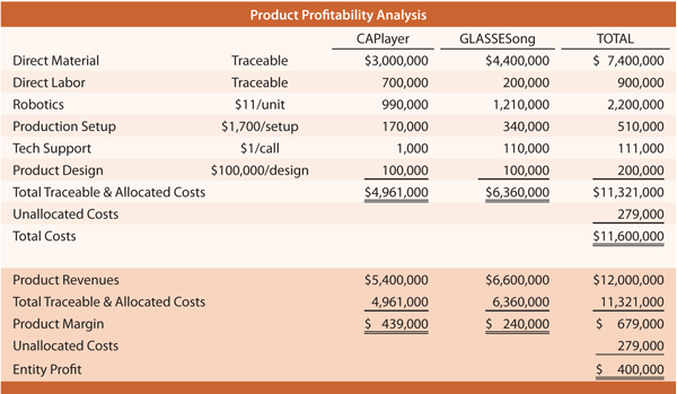
APPLY COSTS TO COST OBJECTS :
The final step is to analyze results. The top portion of the following analysis applies the per-activity cost information to show how the total cost of CAPlayer is less than the total cost of GLASSESong. The lower portion compares costs and revenues to determine product profitability. Unallocated cost is included in the total column only; it is important, but not tied to either product. Product profitability is portrayed differently under alternative costing methods. Traditional costing applied overhead based on direct labor which is a small portion of the environment. The point is that skill is required to interpret any costing information.
The final step is to analyze results. The top portion of the following analysis applies the per-activity cost information to show how the total cost of CAPlayer is less than the total cost of GLASSESong. The lower portion compares costs and revenues to determine product profitability. Unallocated cost is included in the total column only; it is important, but not tied to either product. Product profitability is portrayed differently under alternative costing methods. Traditional costing applied overhead based on direct labor which is a small portion of the environment. The point is that skill is required to interpret any costing information.